Singular Value Decomposition
Singular Value Decompostion application to Image Compression
The singular value decomposition (SVD) is an important matrix factorization technique that provides a numerically stable matrix decomposition that can be used for a variety of purposes such as to obtain low-rank approximations to matrices and to perform pseudo-inverses of non-square matrices to find the solution of a system of equations \(\text{Ax = b}\).
Generally, we are interested in analyzing a large data set \(X \in \mathbb{C}^{n\times m}\).
\[\mathbf{X}=\left[\begin{array}{cccc} \mid & \mid & & \mid \\ \mathbf{x}_1 & \mathbf{x}_2 & \cdots & \mathbf{x}_m \\ \mid & \mid & & \mid \end{array}\right]\]For many systems \(n \gg m\), resulting in a tall-skinny matrix, as opposed to a short-fat matrix when \(n \ll m\). The SVD is a unique matrix decomposition that exists for every complex valued matrix \(X \in \mathbb{C}^{n\times m}\):
\[\mathrm{X} = \mathrm{U\Sigma V}^*\]where \(U \in \mathbb{C}^{n\times n}\) and \(V \in \mathbb{C}^{m\times m}\) are unitary matrices with orthonormal columns, and \(\mathrm{\Sigma} \in \mathbb{C}^{n\times m}\) is a matrix with real, non-negative entries on the diagonal and zeros off the diagonal.
When \(n \geq m\), the matrix \(\mathrm{\Sigma}\) has at most m non-zero elements on the diagonal, and may be written as
\[\boldsymbol{\Sigma}=\left[\begin{array}{l} \hat{\Sigma} \\ 0 \end{array}\right] \text {. }\]Therefore, it is possible to exactly represent X using the economy SVD:
\[\mathrm{X} = \mathrm{U\Sigma V}^* = \left[\begin{array}{ll} \hat{U} & \hat{U}^{\perp} \end{array}\right]\left[\begin{array}{c} \hat{\Sigma} \\ 0 \end{array}\right] \mathrm{V}^* = \hat{U}\hat{\Sigma}\hat{V}^*\]The columns of \(\hat{U}^{\perp}\) span a vector space that is complementary and orthogonal to that spanned by \(\hat{U}\). The columns of V are right singular vectors and the columns of U are called left singular vectors of X. The diagonal elements of \(\hat{\Sigma} \in \mathbb{C}^{n\times m}\) are called singular values and they are ordered from largest to smallest. The rank of X is equal to the number of non-zero singular values. In order to find \(U, \Sigma \text{ and } V\) we use:
\(\mathrm{X}^* \mathrm{X}=\mathrm{V}\left[\begin{array}{ll} \hat{\Sigma} & 0 \end{array}\right] \mathrm{U}^* \mathrm{U}\left[\begin{array}{c} \hat{\Sigma} \\ 0 \end{array}\right] \mathrm{V}^*=\mathrm{V} \hat{\Sigma}^2 \mathrm{~V}^*\) and
\[XV = U\Sigma\]Example
Find the singular value decomposition of the matrix:
\[A = \begin{bmatrix} 1 & 3\\ 2 & 6 \end{bmatrix}\]The two formulas to be used
\[\mathrm{A}^T \mathrm{A}=\mathrm{V}\left[\begin{array}{ll} \hat{\Sigma} & 0 \end{array}\right] \mathrm{U}^T \mathrm{U}\left[\begin{array}{c} \hat{\Sigma} \\ 0 \end{array}\right] \mathrm{V}^*=\mathrm{V} \hat{\Sigma}^2 \mathrm{~V}^T\] \[AV = U\Sigma\] \[\mathrm{A}^T \mathrm{A} = \begin{bmatrix} 5 & -1\\ 5 & 7 \end{bmatrix} \begin{bmatrix} 5 & 5\\ -1 & 7 \end{bmatrix} = \begin{bmatrix} 26 & 18\\ 18 & 74 \end{bmatrix}\]This is Diagonalization of \(A^{T}A\). Thus we find eigenvalues which will be the diagonal entries of \(\Sigma^{2}\) and eigenvectors whic will the columns of \(V\). This is done by
\[\operatorname{det}\left(A^{\top} A-\lambda I\right)=\operatorname{det}\left(\begin{array}{cc} 26-\lambda & 18 \\ 18 & 74-\lambda \end{array}\right)\] \[= \lambda^{2} -100\lambda + 1600\] \[= (\lambda-20)(\lambda - 80)\] \[\lambda=20 \text{ and } \lambda = 80\] \[\operatorname{det}\left(A^{\top} A-20 I\right)=\begin{bmatrix} 6 & 18\\ 18 & 54 \end{bmatrix}\] \[v_{1}=\begin{bmatrix}-3 \\ 1 \end{bmatrix} \text{ normalized } v_{1}=\begin{bmatrix}\frac{-3}{\sqrt{10}} \\ \frac{1}{\sqrt{10}} \end{bmatrix}\] \[\operatorname{det}\left(A^{\top} A-80 I\right)=\begin{bmatrix} -54 & 18\\ 18 & -6 \end{bmatrix}\] \[v_{2}=\begin{bmatrix}1 \\ 3 \end{bmatrix} \text{ normalized } v_{2}=\begin{bmatrix}\frac{1}{\sqrt{10}} \\ \frac{3}{\sqrt{10}} \end{bmatrix}\] \[V = \begin{bmatrix} \frac{-3}{\sqrt{10}} & \frac{1}{\sqrt{10}}\\ \frac{1}{\sqrt{10}} & \frac{3}{\sqrt{10}} \end{bmatrix} \text{ and } \Sigma = \begin{bmatrix} 2\sqrt{5} & 0\\ 0 & 4\sqrt{5} \end{bmatrix}\]Finding \(U\), it follows
\[AV= \begin{bmatrix} 5 & 5\\ -1 & 7 \end{bmatrix} \begin{bmatrix} \frac{-3}{\sqrt{10}} & \frac{1}{\sqrt{10}}\\ \frac{1}{\sqrt{10}} & \frac{3}{\sqrt{10}} \end{bmatrix} = \begin{bmatrix} -\sqrt{10} & 2\sqrt{10}\\ \sqrt{10}& 2\sqrt{10} \end{bmatrix}\] \[= \begin{bmatrix} \frac{-1}{\sqrt{2}} & \frac{1}{\sqrt{2}}\\ \frac{1}{\sqrt{2}} & \frac{1}{\sqrt{2}} \end{bmatrix} \begin{bmatrix} 2\sqrt{5} & 0\\ 0 & 4\sqrt{5} \end{bmatrix}\] \[U = \begin{bmatrix} \frac{-1}{\sqrt{2}} & \frac{1}{\sqrt{2}}\\ \frac{1}{\sqrt{2}} & \frac{1}{\sqrt{2}} \end{bmatrix}\]Application
Image Compression through matrix approximation
The most useful and defining property of the SVD is that it provides an optimal low-rank approximation to a matrix \(X\). Thus, high-dimensional data may be well described by a few dominant patterns given by the columns of \(\hat{U} \text{ and } \hat{V}\). We consder the image of a bridge at the beach as shown below This image has size of \(2000 \text{ by } 1125\) pixels.
Original

Install dependancies
from matplotlib.image import imread
import matplotlib.pyplot as plt
import numpy as np
import os
%matplotlib inline
# openCV for image reading
import cv2 as cv
plt.rcParams['figure.figsize'] = [16, 10]
path = r"./SVD/images/landscape_3.jpg" # You can put your image
Convert image to grayscale
# Read and plot the image
A = cv.imread(path) # or use -- imread(pathfull_matrices=#X = np.mean(A, -1);
X =  cv.cvtColor(A, cv.COLOR_BGR2GRAY) # convert to gray
fig, ax = plt.subplots(1,1)

img2 = ax.imshow(256 - X)
img2.set_cmap('gray')
ax.axis("off")
ax.set_title("Grayscale")
Gray

We apply the svd code on this image:
# Full size
nx, ny = list(A.shape)[0:2]
(nx, ny)
#SVD
def svd(X):
    U, S, V_t = np.linalg.svd(X, full_matrices = False)
    S = np.diag(S)
    return U, S, V_t
# Call SVD function
U, S, V_t = svd(X)
for i in range(0,np.sum(len(S))-1):
    if S[i+1,i+1] > S[i,i]:
        print("Not strictly nondecreasing")
print("Ordered diagonal values strictly decreaseing from left to right")
k =0
lst = [5 , 10, 20, 50]
fig, ax = plt.subplots(2,2)
for i in [0, 1]:
    for j in [0, 1]:
        r = lst[0 + k]
        k += 1
        # Storage size
        s = round(100*r*(nx+ny)/(nx*ny), 2)
        # Approximation of X
        X_appr = U[:, :r] @ S[:r, :r] @ V_t[:r, :]
        img = ax[i, j].imshow(250 - X_appr)
        img.set_cmap('gray')
        ax[i,j].axis('off')
        ax[i, j].set_title(f"r = {r} with storage {s}%")
        #plt.show()
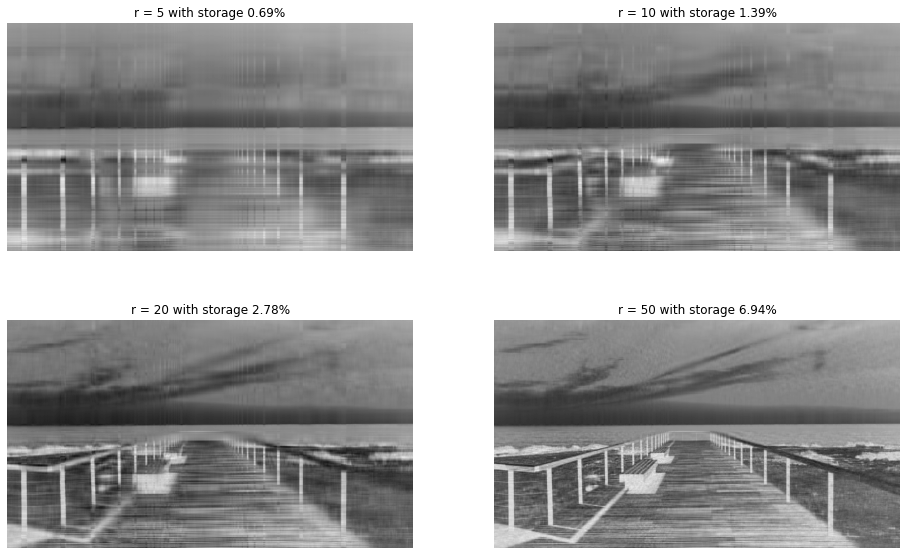
The plots below show truncation of the columns to when \(r = 5, 10, 20 \text{ and } 50\)

Plot the diagonal singular values:
# anaysis

fig, ax = plt.subplots(2,2)
#plt.figure(figsize=[8,6])
ax[0,0].plot(np.diag(S))
ax[0,0].set_xlabel('k')
ax[0,0].set_ylabel('singular values')
ax[0,0].set_title('Singular values')


#plt.figure(figsize=[8,6])
ax[0,1].semilogy(np.diag(S))
ax[0,1].set_xlabel('k')
ax[0,1].set_ylabel('singular values log')
ax[0,1].set_title('singular values')
#plt.semilogy(1200, S[1200,1200]), marker='*',\\
 ls='none', ms=20, label='line with select markers')
x = 25
y = np.sum(np.diag(S[:x,:x]))/np.sum(np.diag(S))
#plt.figure(figsize=[8,6])
ax[1, 0].plot(np.cumsum(np.diag(S))/np.sum(np.diag(S)))
ax[1, 0].plot(x, np.sum(np.diag(S[:x,:x]))/np.sum(np.diag(S)), \\
marker='*', ls='none', ms=20, label='line with select markers')
ax[1, 0].text(x-.6, y-.06, f'{x}==>{round(y,2)}%', fontsize=9)
ax[1, 0].set_xlabel('k')
ax[1, 0].set_ylabel('cummlative energy')
ax[1, 0].set_title(f'Cummulative energy at {x}')
x = 400
y = np.sum(np.diag(S[:x,:x]))/np.sum(np.diag(S))
#plt.figure(figsize=[8,6])
ax[1, 1].plot(np.cumsum(np.diag(S))/np.sum(np.diag(S)))
ax[1, 1].plot(x, np.sum(np.diag(S[:x,:x]))/np.sum(np.diag(S)),\\
 marker='*', ls='none', ms=20, label='line with select markers')
ax[1, 1].text(x-.6, y-.06, f'{x}==>{round(y,2)}%', fontsize=9)
ax[1, 1].set_xlabel('k')
ax[1, 1].set_ylabel('cummlative energy')
ax[1, 1].set_title(f'Cummulative energy at {x}')
The result

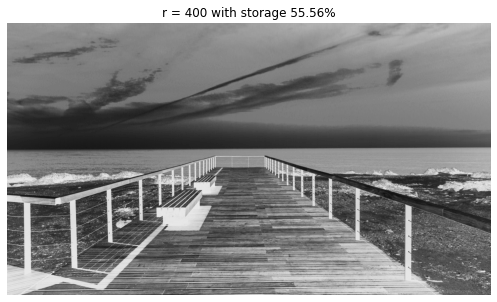
Test for around 92% of the cummulative energy where r = 400.
r = 400
# Storage size
s = round(100*r*(nx+ny)/(nx*ny), 2)
X_appr = U[:, :r] @ S[:r, :r] @ V_t[:r, :]
plt.figure(figsize= (10,5))
img = plt.imshow(250 - X_appr)
img.set_cmap('gray')
plt.axis('off')
plt.title(f"r = {r} with storage {s}%")
plt.show()
we get:

That’s all. Thank You.

Comments